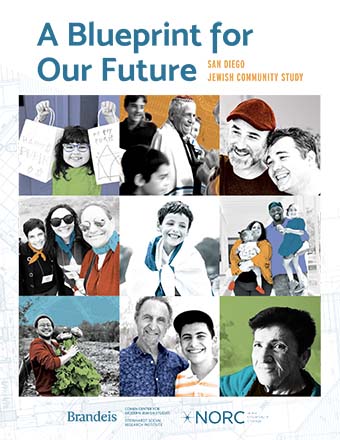
A Blueprint for our Future: 2022 San Diego Jewish Community Study
Janet Krasner Aronson, Matthew A. Brookner, Matthew Boxer, Leonard Saxe, Zachary Seeskin, David Dutwin with Adina Bankier-Karp, Alicia Chandler, Daniella Levine, Adam Martin, and Raquel Magidin de Kramer
November 2023
A Blueprint for our Future: The 2022 San Diego Jewish Community Study was conducted by the Maurice and Marilyn Cohen Center for Modern Jewish Studies (CMJS) at Brandeis University, in partnership with NORC at the University of Chicago. The principal goal of this study is to provide valid data about the San Diego Jewish community that can be used by communal organizations and their leadership to design programs and policies that support and enhance Jewish life. Valid data are essential to effective decision making, allocation of resources, strategic priorities, community support, robust participation, and outreach. This report is based on data collected from 2,104 Jewish households in San Diego between June and September 2022. Survey respondents were randomly selected from all households in Greater San Diego.
Download the comparison charts
Among the findings:
- There are 134,100 individuals living in 56,200 Jewish households in San Diego, of whom 100,700 are Jewish in some way.
- The rate of growth of the San Diego Jewish population since 2003 (13%) is similar to the growth of the overall county population (14%).
- The San Diego Jewish community is older than the general population of the area and of the US Jewish community. In the San Diego Jewish community, 12% of Jewish individuals are children. In contrast, 21% of all of San Diego County residents are children, and 24% of all US Jewish individuals are children. The smaller share of children corresponds to a larger share of older adults. In the San Diego Jewish community, 17% of Jewish individuals are ages 65 to 74. In contrast, 11% of all of San Diego County residents are ages 65 to 74, and 10% of all US Jewish individuals are ages 65 to 74.
- Nearly three quarters of Jewish adults are married or living with a partner. Of these adults, about half (49%) have a non-Jewish spouse or partner, higher than the share in the national Jewish population (42%).
- While 18% of Jewish individuals in San Diego identify as Hispanic or as any racial group other than white, 6% identify as a Person of Color. Although 5% of Jewish adults identify as a Person of Color, a larger share (13%) of Jewish children is identified as Persons of Color by their parents. This difference suggests that the Jewish community may become more racially and ethnically diverse in the future.
- The largest share of Jewish individuals lives in the Central region (41%), including almost half (48%) of Jewish children. Among Jewish individuals ages 18 to 34, 39% live in the South region.
- Seventeen percent of Jewish households in San Diego include an individual who was born outside the United States.
- Thirty percent of Jewish adults are relative newcomers to San Diego, with 16% having lived in the area for five to nine years, and 14% having moved to the area within the past four years. More than half of newcomers are younger than age 35.
- Nearly one quarter of Jewish households (23%) have members who regularly speak a language other than English at home, including 15% who have members who never speak English at home.
- Among Jewish adults ages 75 and older, 9% are Holocaust survivors or World War II refugees.
- Among Jewish adults in San Diego, 3% identify as Orthodox, 15% as Conservative, 23% as Reform, and 9% as some other denomination. Fully half of Jewish adults (50%) do not identify with a specific denomination. In comparison, among all US Jews, 32% do not identify with a denomination.
- About three quarters of Jewish adults (76%) describe their Jewish heritage as Ashkenazi and 11% describe their heritage as Sephardi. Four percent of Jewish adults identify as Mizrachi or some other heritage. Nationally, 71% of Jewish adults are Ashkenazi, 6% Sephardi, and 3% Mizrachi or some other heritage.
- The majority of Jewish adults in San Diego describe their political orientation as liberal, either extremely liberal (17%), liberal (41%), or slightly liberal (10%). In total, about two thirds of San Diego’s Jews are liberal, compared to half of US Jewry.
