Simulations of Active Nematics
We developed a simulation model for active nematics, motivated by recent experiments in the lab of Zvonimir Dogic (Brandeis). They developed a minimal in vitro system that reproduces behaviors formally found only in biological organisms, such as streaming flows and cilia-like beating [1].
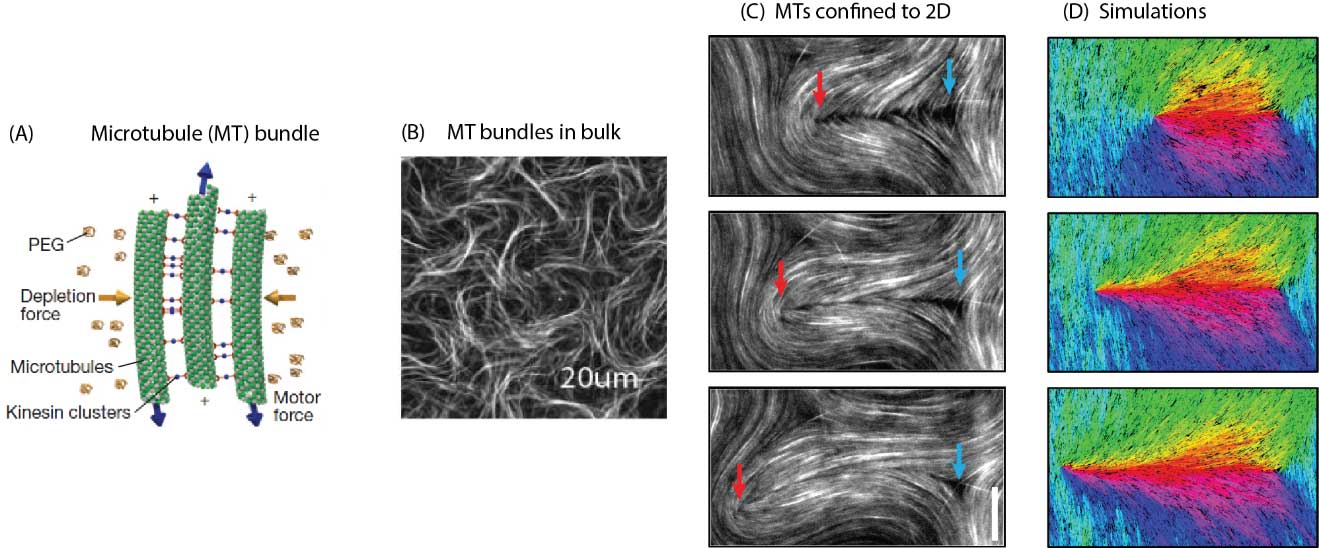
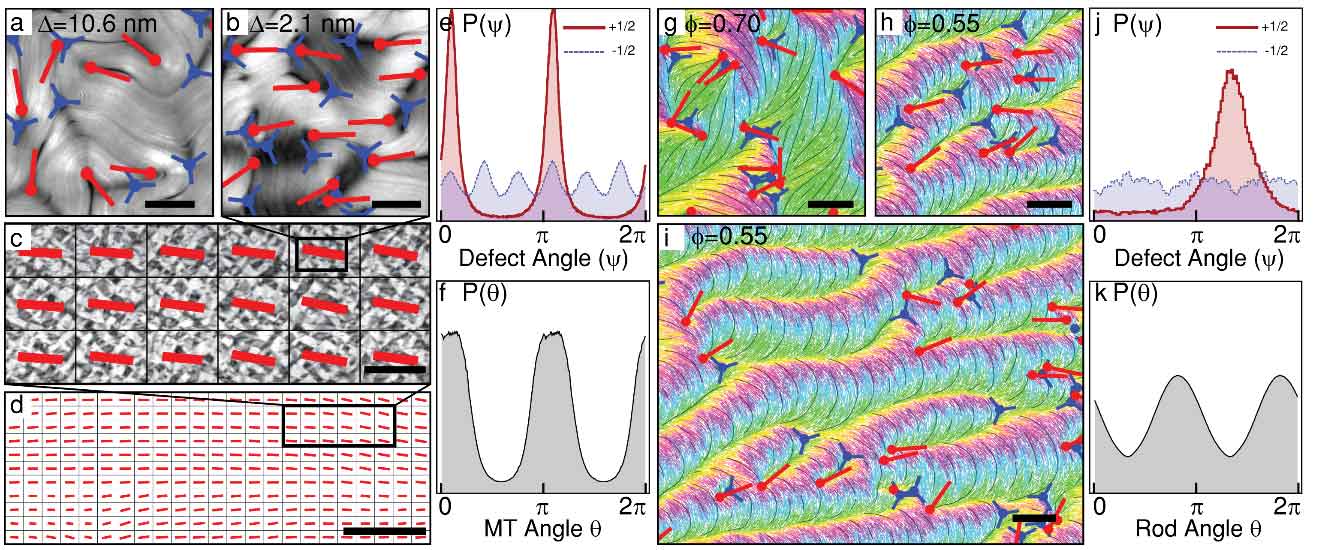
The system contains microtubules, a depletion agent which causes bundling, and motor protein complexes that push pairs of microtubules past one another. The action of motor proteins causes bundles to undergo longitudinal extension until they eventually break, while the depletion forces cause nearby bundles to merge laterally. In bulk, bundles reach a steady-state density and form an active gel, characterized by large scale flows [1]. When the system is confined to two dimensions (on an oil-water interface), the bundles form a nematic phase (Fig. 1). However, due to bundle extensility, the uniform nematic state is unstable to the formation of topological defect pairs (Fig. 2). Defect pairs spontaneously appear, unbind, move through the sample, and annihilate, producing a seemingly chaotic steady-state. Since defect behaviors dictate the material properties, our group developed an algorithm to identify and track defects, both from experimental images and computational model output.
In the computational model hard spherocylinders which undergo extension from both ends at an ATP-concentration-dependent rate represent the extensile bundles observed in experiments. Using the defect tracking algorithm, we have measured lifetime, motility and interactions of defects in the active nematics experiments and computational trajectories. This data shows that, although that active nematics are inherently unstable against bend fluctuations [2], they retain long range order. In particular, motile +1/2 defect which have polar symmetry interact with each other and form a supra-molecular dynamical phase of highly-order defects. Such a defect-ordered phase has not been previously observed in active systems; its emergence in both the experimental and computational systems suggest that it may be a generic feature of active nematics. The work is described in [3]

Fig. 1: Extensile microtubule (MT) bundle system developed by Dogic and coworkers [1]. (A) System components and schematic of an MT bundle. (B) The MT bundles form an isotropic gel in 3 dimensions (microtubules are fluorescently labeled). (C) Confinement of the MTs and motor proteins to 2 dimensions results in an active nematic. The arrows indicate locations of defects, and their color indicates the topological charge (red is +1/2, blue is -1/2). (D) Simulations of extensile rods (described in the text) produce similar dynamics and defects. Color indicates rod orientations.

Fig. 2: Defects in active nematics aquire (quasi)long-range order in experiments (left) and simulations (right). (a) Retardance map of a thick MT film in the regime of weak defect alignment. Red and blue markers indicate locations and orientations of +1/2 and −1/2 defects. Scale bar is 200µm. (b) Thin MT film showing strong alignment of +1/2 defects. Scale bar is 200µm. (c) Orientational order in a large active nematic sample. Each red bar’s orientation and length indicates the mean direction and strength of defect alignment in one field of view. Scale bar is 2mm. (d) Defect alignment spans the largest samples studied (6cm × 2cm), containing ∼20,000 defects. Scale bar is 10mm. (e) Normalized histogram of +1/2 (red) and −1/2 (blue) defect orientations, P (ψ), and f, MT orientations, P (θ), for the sample shown in panels b-d. Measurements of P (θ) from 0 to π are duplicated from π to 2π. Both P (ψ) and P (θ) show strong nematic ordering. (g) Snapshot of a high- area-fraction simulation in which +1/2 defects are not aligned. Scale bar is 5 x the maximum bundle length, Lmax. (h) A low-area-fraction system in which defects show flocking-like polar alignment. Scale bar is 5Lmax. (i) A large simulation with defects aligned over long distances. Scale bar is 5Lmax. (j) Normalized histogram of +1/2 (red) and −1/2 (blue) defect orientations, P (ψ), and (k) rod orientations P (θ). The former shows polar ordering, while the latter exhibits nematic ordering, and the preferred axes are offset by 90 degrees. Figure is from [3].
References
- Sanchez, T., D.T.N. Chen, S.J. DeCamp, M. Heymann, and Z. Dogic, Spontaneous motion in hierarchically assembled active matter. Nature, 2012. 491(7424): 431-434.
- Aditi Simha, R. and S. Ramaswamy, Hydrodynamic Fluctuations and Instabilities in Ordered Suspensions of Self-Propelled Particles. Phys. Rev. Lett., 2002. 89(5): 058101.
- DeCamp, S.J., G.S. Redner, A. Baskaran, M.F. Hagan, and Z. Dogic, Orientational order of motile defects in active nematics. arXiv:1501.06228, 2015.