Effects of Confinement Geometry on Active Matter
Interactions between cellular components and the cell membrane play a key role in many cellular functions.
For example, in a Drosophila oocyte, membrane confinement organizes molecular-motor-driven motions of cytoplasmic contents to produce the spontaneous circulation known as cytoplasmic streaming [1]. Boundaries also influence, and are influenced by, collective behaviors of cells. For example, swimming bacteria can be concentrated by funnel-shaped boundaries, while the motions of a bacterial bath can turn microscopic gears [2, 3]. Boundaries are necessarily present in any real-world active matter system, and these examples illustrate that certain sizes or shapes of boundaries can dramatically alter the dynamics of active systems. Yet, most theoretical active matter research has neglected boundaries, and there is currently no general theory for the effect of boundary geometry.
Motivated by this need, Yaouen Fily developed a statistical theory for non-aligning and non-interacting self-propelled particles confined to convex containers [4]. The theory and computer simulations showed that confinement dramatically affects the behavior of self-propelled particles. Below a threshold container size, the active particles are confined to the boundary, with a density that is inversely proportional to, and a pressure that decays exponentially with, the local boundary curvature (Fig. 1A,C). We have now extended the theory to also describe non-convex containers [5] (Fig. 1B). Thus, the theory now allows predicting particle densities for any box shape, and also enables designing a box shape to realize virtually any desired particle distribution. We have now extended the analysis to 3D (Fig. 1D), where we find that the particle density is proportional to the local Gaussian curvature of the boundary.
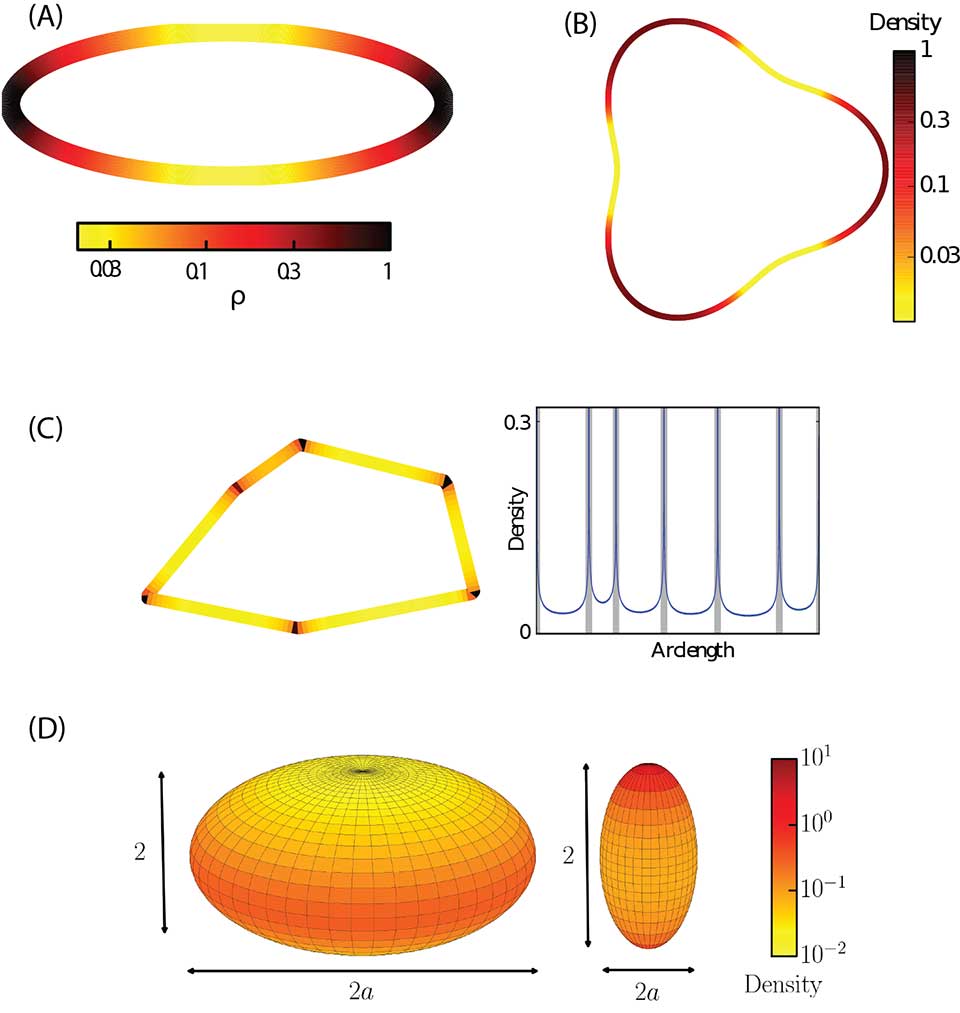
Fig. 1: Self-propelled spheres collect on container boundaries, with a density proportional to the local boundary curvature. All results are shown for non-aligning, noninteracting self-propelled spheres. (A) A heat map showing the steady-state density of self-propelled spheres on a convex container in 2D [4]. (B) The steady-state density of self-propelled spheres on a non-convex container in 2D [5]. (C) Steady-state density of self-propelled spheres and polygonal containers. (left) Heat map showing steady-state density. (right) plot showing density as a function of arc length along the container boundary, starting in the upper right corner and moving counterclockwise. (D) Steady-state density of self-propelled spheres on the boundary of 3D containers. The density is proportional to the local Gaussian curvature.
References
- Serbus, L.R., B.-J. Cha, W.E. Theurkauf, and W.M. Saxton, Dynein and the actin cytoskeleton control kinesin-driven cytoplasmic streaming in Drosophila oocytes. Development, 2005. 132(16): 3743-3752.
- Sokolov, A., M.M. Apodaca, B.A. Grzybowski, and I.S. Aranson, Swimming bacteria power microscopic gears. Proc. Natl. Acad. Sci. U. S. A., 2010. 107(3): 969-974.
- Galajda, P., J. Keymer, P. Chaikin, and R. Austin, A wall of funnels concentrates swimming bacteria. J. Bacteriol., 2007. 189(23): 8704-8707.
- Fily, Y., A. Baskaran, and M.F. Hagan, Dynamics of self-propelled particles under strong confinement. Soft Matter, 2014. 10(30): 5609-5617.
- Fily, Y., A. Baskaran, and M.F. Hagan, Dynamics and density distribution of strongly confined noninteracting nonaligning self-propelled particles in a nonconvex boundary. Physical Review E, 2015. 91(1): 012125.