2011 Research Highlights
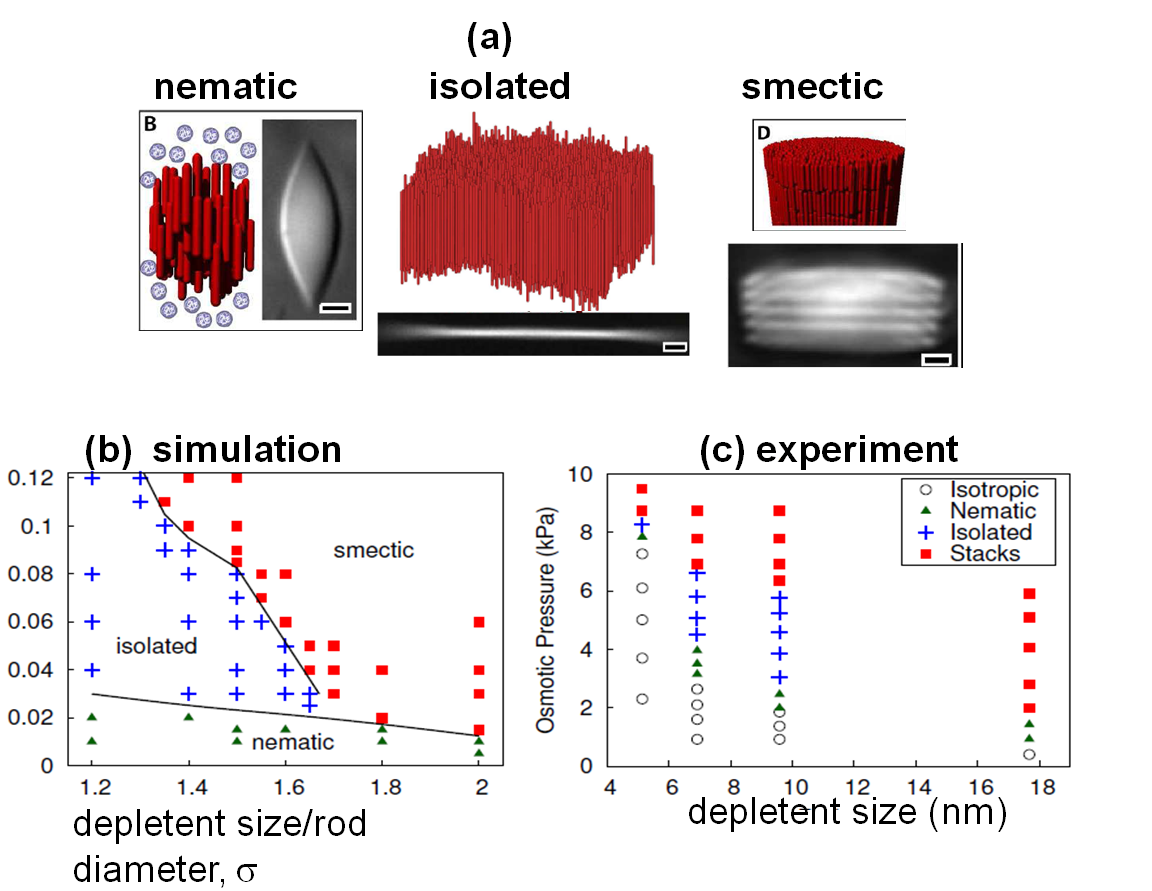
Simulations elucidate the forces that drive formation of colloidal membranes, or monolayers of aligned nanorods. Predicted phase behavior is shown in (b) for a simulation model of hard spherocylinders and depletent. Results are compared to experiments (c) on the rodlike virus fd and nonadsorbing PEO polymers
Colloidal membranes are two dimensional (2D) surfaces composed of a one rod-length thick monolayer of aligned nanorods. Zvonimir Dogic's group recently discovered that suspensions of homogeneous rodlike viruses and non-adsorbing polymer form equilibrium colloidal membranes under some conditions, and smectic-like stacks of membranes under other conditions. While the colloidal membranes are macroscopic in two dimensions, they remain only one rod length thick in the third. To understand the forces that drive assembly in two dimensions while limiting it in the third, Mike Hagan's group developed computer simulations and a density functional theory that describe the phase behavior of colloidal membranes. The calculations demonstrate that collective protrusion fluctuations stabilize colloidal membranes. They also predict the phase behavior as a function of experimental control parameters: polymer radius of gyration and rod aspect ratio. The calculations predict that colloidal membranes are never stable below a threshold aspect ratio and above a threshold polymer radius of gyration. The latter prediction has been qualitatively confirmed by experiments in the Dogic lab. A report of this work is available here.
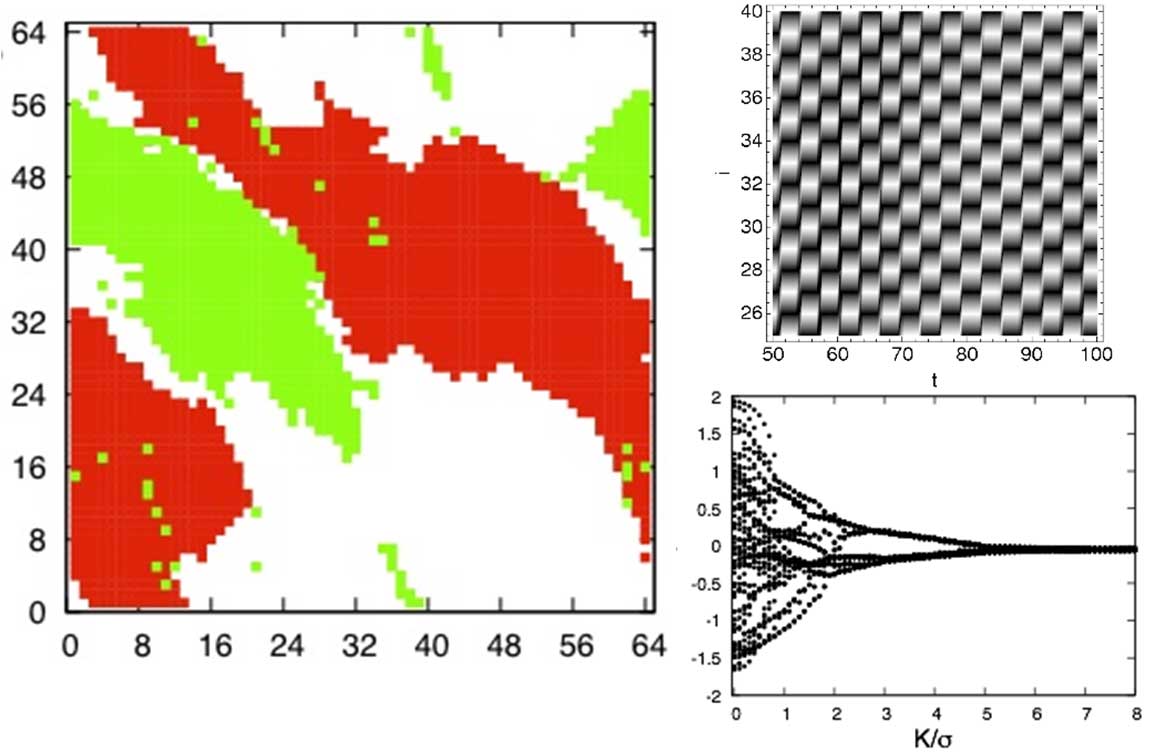
Left: Domains with opposite helicities (red and white regions) seen on a 2D triangular lattice of 64X64 oscillators. Phase difference between neighboring oscillators on a row in the two domains are either. Frequency synchronized clusters (green regions) are seen in the interior of the domains and typically mark the stable growing domain. Right: Space time plot of 1D ring of 64 Kuramoto oscillators in a fully synchronized anti-phase state at large coupling strength (top) and time averaged frequency of all 64 oscillators plotted as a function of coupling strength (bottom).
The BZ micro-oscillators were modeled by phase oscillators place on a lattice and coupled via nearest-neighbor interactions. The intrinsic frequencies of the oscillators were picked from a Gaussian distribution. With repulsive coupling, the stable attractors of the deterministic form, with no randomness in intrinsic frequencies, are states in which the nearest neighbor oscillators are p out of phase. On a triangular geometry, or on a ring with odd number of oscillators, these stable states are frustrated. On a triangular lattice, we found that the system forms states with domains of oscillators where nearest neighbors are 2p/3 out of phase. Frequency synchronization spreads from the centers of the domains, and at large enough couplings, oscillators are synchronized in frequency but the phase pattern is disordered with frozen domain patterns. Neighboring oscillators on the domain boundaries have a phase difference of p. The freezing of the domains can be interpreted as the system developing a negative surface tension, which can be traced back to its preference of a p phase difference between neighboring oscillators. This work was led by Professor Chakraborty.
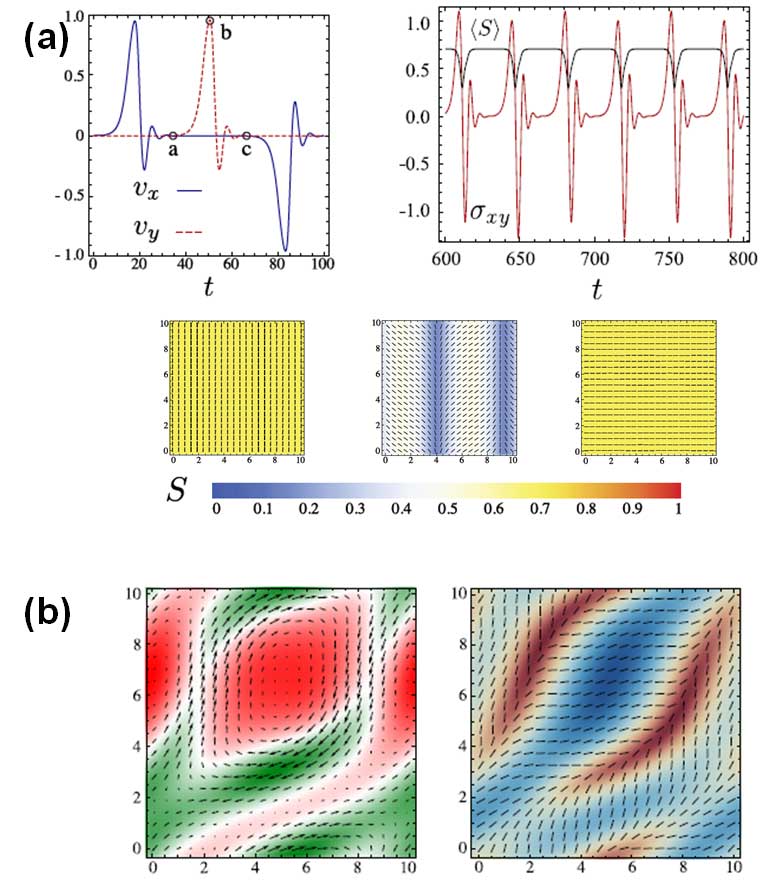
Theory predictions for a two dimensional system are shown. (a) Moderate activity. The components of the flow velocity are depicted on the upper left graph) with vx (blue line) and vy (red dotted line). The shear stress (sxy) is shown on the upper right graph, and the average value of the nematic order parameter, S, are shown as a function of time, exhibiting relaxation oscillations. This 3rd figure has 3 graphs and one spectrum of color marked from 1 - 1. ( Fig. b) Large activity (Left) The fluid flow field is superimposed on a plot of nematogen concentration. (Right) The nematic director field is superimposed on a plot of the magnitude of the nematic order parameter, S.
The first hydrodynamic theory for active matter with spatial variations in the magnitude of the nematic order parameter predicts that the interplay between non-uniform nematic order, activity and flow results in spatially modulated relaxation oscillations, similar to those seen in excitable media and biological examples such as the cardiac cycle. This research was lead by B. Chakraborty and M. Hagan.
Theory predictions for a two dimensional system are shown. (a) Moderate activity. The components of the flow velocity, vx and vy, the shear stress (sxy) and the average value of the nematic order parameter, S, are shown as a function of time, exhibiting relaxation oscillations. (b) Large activity. (left) The fluid flow field is superimposed on a plot of nematogen concentration. (right) The nematic director field is superimposed on a plot of the magnitude of the nematic order parameter, S. The predictions can be tested with experiments on microtubules and motor protein clusters. This research is reported in Physical Review Letters.
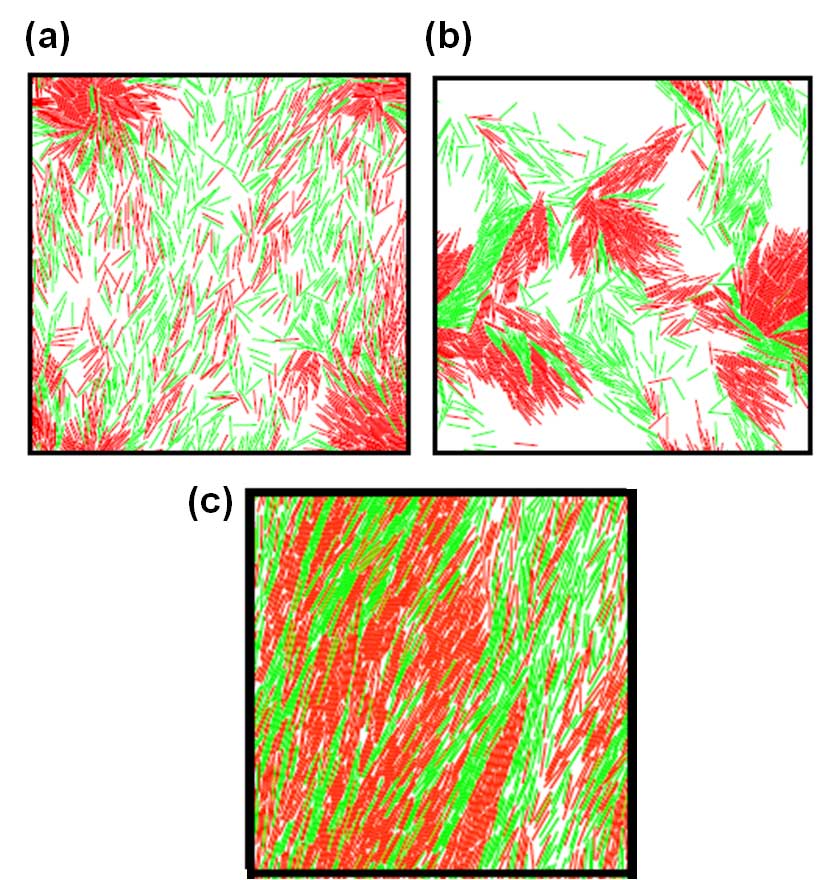
Simulations carried out by the Hagan group predict that self-propelled and passive rods segregate. Snapshots are shown from simulations of spherocylinders with repulsive hard-core interactions. The spherocylinders are identical except that 60% of them are self-propelled (shown in red) while the other 40% experience only passive Brownian motion (shown in green). Typical snapshots are shown from simulations with (a) moderate density and low self propulsion speed, (b) moderate density and moderate self propulsion speed, and (c) high-density and moderate self propulsion speed. These predictions can be tested with the experiments that monitor mixtures of motile and non-motile bacteria.
![]()
A National Science Foundation sponsored Material Research Science and Engineering Center
![]()