Interactive Dashboard User Guide
The Tableau Project “Course Enrollment History Fall 2004-Present” consists of two dashboards: Course Enrollment by Term and Course Enrollment by Instructor.
How Do I Know Which Dashboard to Use?
Course Enrollment by Instructor
On the Course Enrollment by Instructor dashboard, you can search for all classes taught by a particular instructor. Because a single course may be taught by multiple instructors, courses may appear multiple times in the table, depending on your chosen filters. Consequently, this dashboard is not to be used to view total enrollments across a subject area or department. It should be used only to answer questions regarding the courses taught by specific instructors.
Questions you can answer using the Course Enrollment by Instructor dashboard:
- What classes has a specific instructor taught in ‘X’ semesters?
- How many different instructors have taught a specific course?
Course Enrollment by Term
On the Course Enrollment by Term dashboard, you can search for a specific course or set of courses in a desired term(s). Although a single course may be taught by multiple instructors, this table displays only the primary instructor of a course. In the event of two primary instructors, only one will be displayed. To search for all instructors of a course within a single term, please see the Course Enrollment by Instructor dashboard.
Questions you can answer using the Course Enrollment by Term dashboard:
- When was a class last taught?
- How many times was a specific class taught in the last ‘X’ years?
- What was the enrollment of a specific class in a single term or across multiple terms?
- What was the enrollment of a group of courses in a specific term or over multiple terms?
How to Use Dashboards
1. You can move between these two dashboards using the tabs at the top of the page.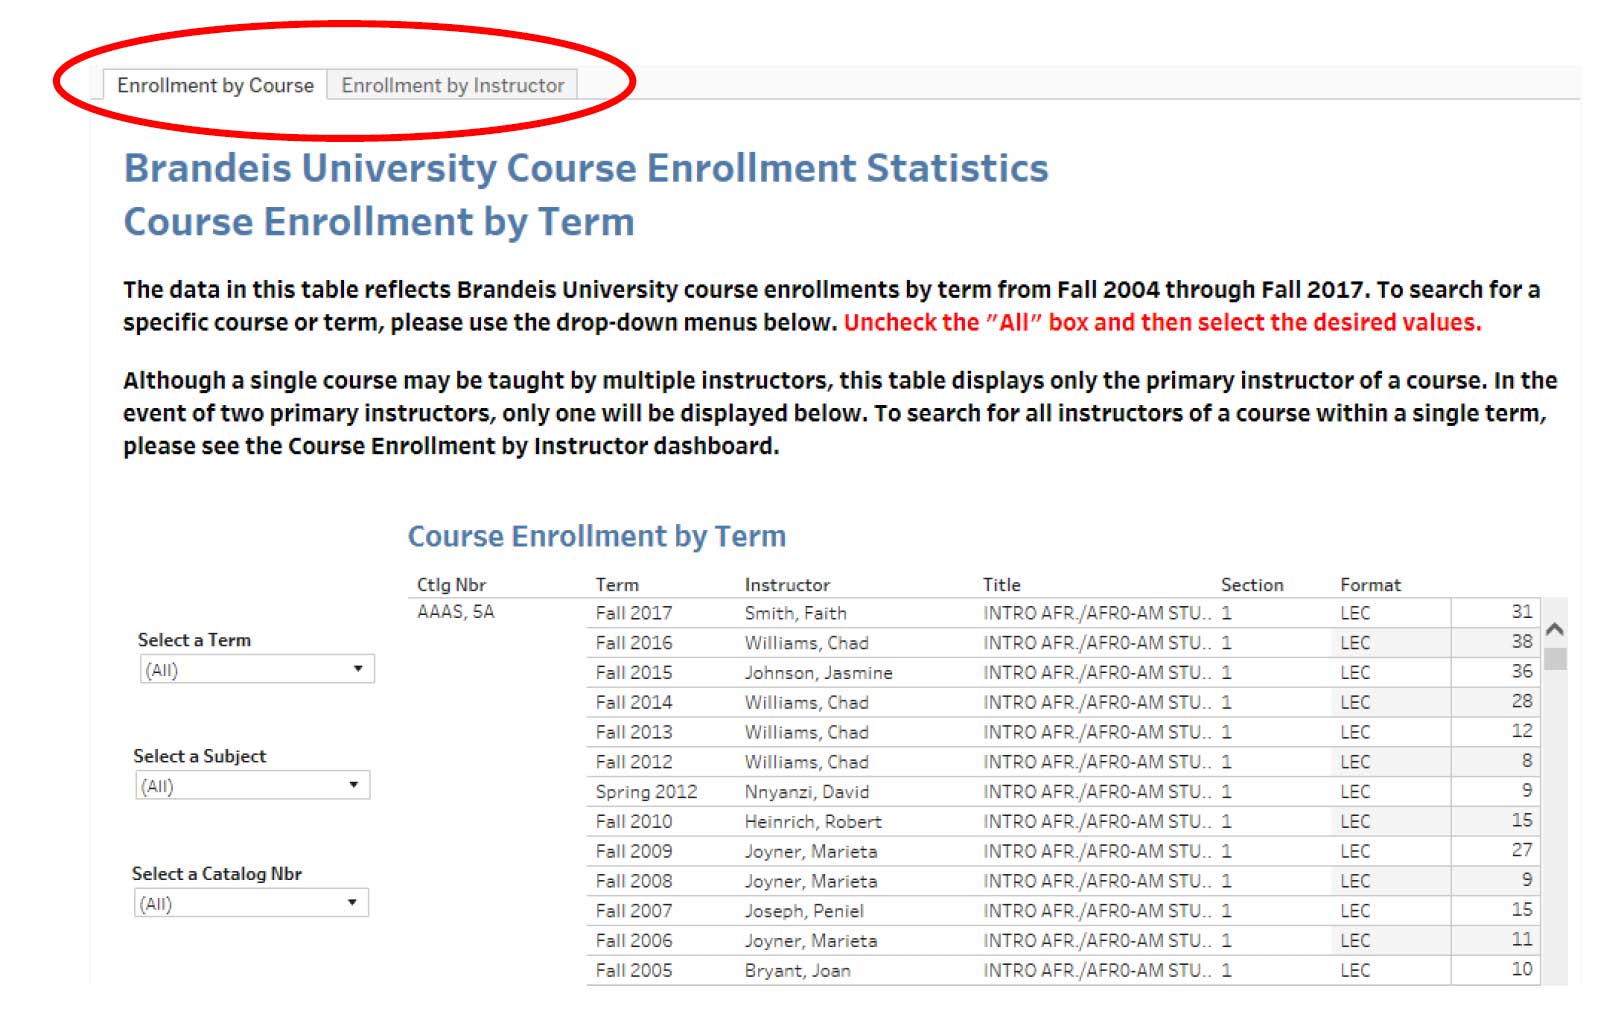
2. To refine the data that appears in each dashboard, use the filters to the left of the table. You will need to uncheck the (All) box and then select the values that you want to appear in your data table.
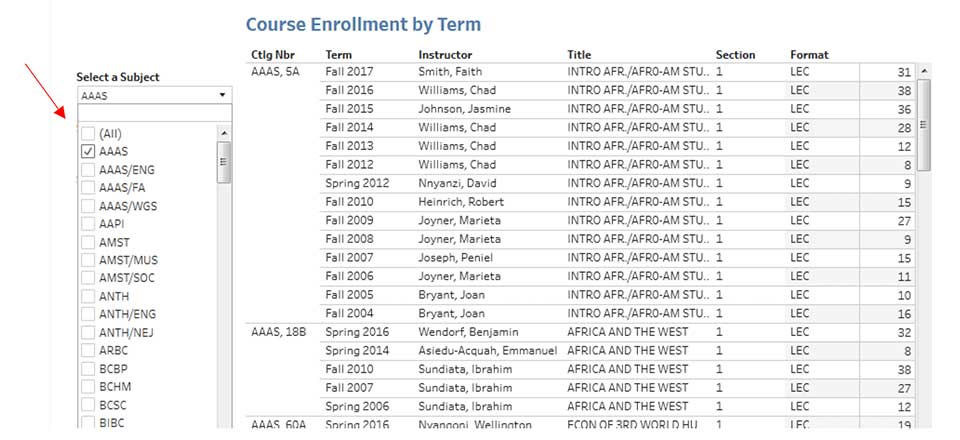
3. You can also select a particular term or search for a specific class over a series of terms.
4. On the bottom of the page, you can select Undo or Reset to easily remove your filters. Use Undo to remove your last selected filter. Use Reset to remove all selected filters and return to the original view.
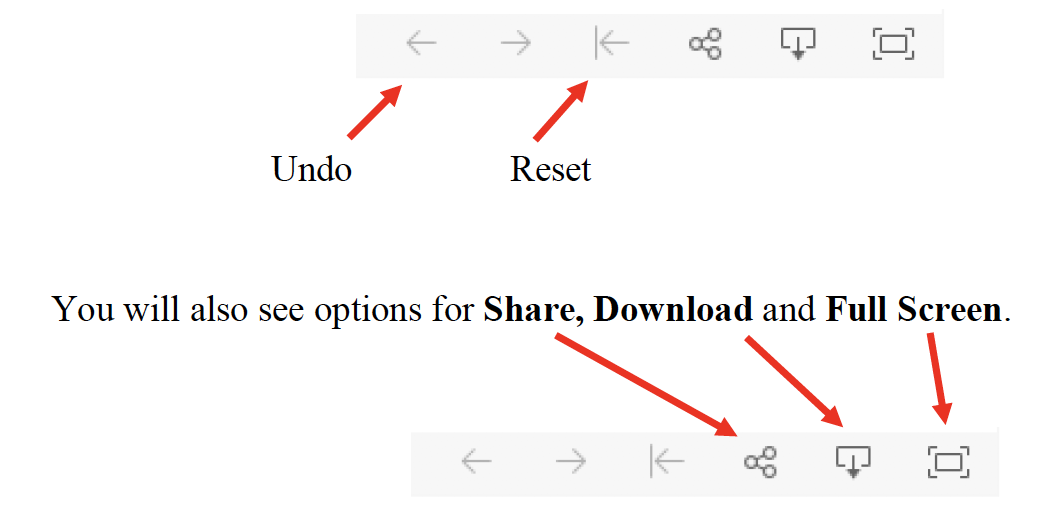
- Full Screen allows you to view the data in Full Screen mode. Hit escape to exit Full Screen mode.
- Download allows you to download a PDF or image of the data that is currently visible on your screen. You may also request an Excel spreadsheet of the data.
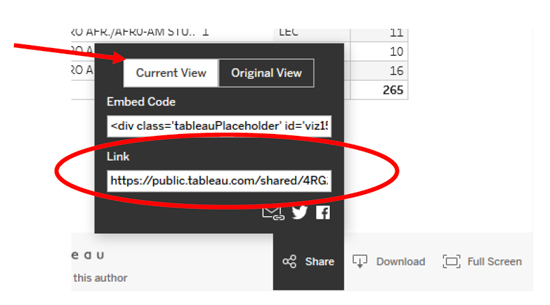
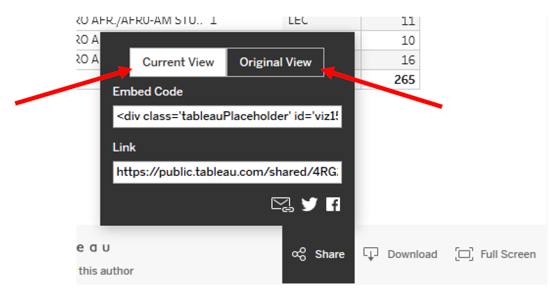
- Share allows you to share the link to this page, which could be useful if you would like to share the information with a specific faculty or staff member. When using the Share option, you can either share the original view of the dashboard (unfiltered), or the current view that includes your filters. Copy the link provided and send it to your desired recipient.
How Often Will These Dashboards Be Updated?
The data displayed in these dashboards will be updated twice a semester: once just after the census date (Oct. 15 and March 15) and once at the end of the term in order to accurately capture Module 2 enrollments.
Can I Download the Data in Excel Format?
No, but you can request an Excel document from the registrar’s office. After you’ve narrowed your data using the dashboard filters, click on the “Share” icon and select “Current View.” Then copy the link and send it to sfallon@brandeis.edu with your request.