Google Analytics
Brandeis uses Google Analytics to track information about how visitors use our website. Google Analytics transitioned from Universal Analytics (UA) to Google Analytics 4 (GA4) in July 2023.
To access GA4 data for your website, please contact us for the log in information. Once you receive the log in information, follow these steps to find the data for your site.
- Visit the Google Analytics website.
- Log in with your Brandeis credentials.
- At the top of the screen next to the Analytics logo, make sure it says (GA4) Master Property. If it doesn't, click the arrow to show more properties and select that property.
- On the left side, hover over the icons and select Reports.
- Under Business Objectives, click Examine User Behavior and then Pages and Screens: Page path and screen class.
- This gives you all of the pages in this property. To narrow down the pages you see to a specific site(s), type applicable URL terms into the Search field directly above the data table. (i.e., if you wanted to see the data for the CMS Guide website, you would enter /cms-guide/ in the search box, and only URLs containing that text would display). Other examples:
- To look at data for the entire Anthropology website, you would enter /anthropology/
- To look at data for Brandeis-run Study abroad programs, you would enter /abroad/brandeis-programs/
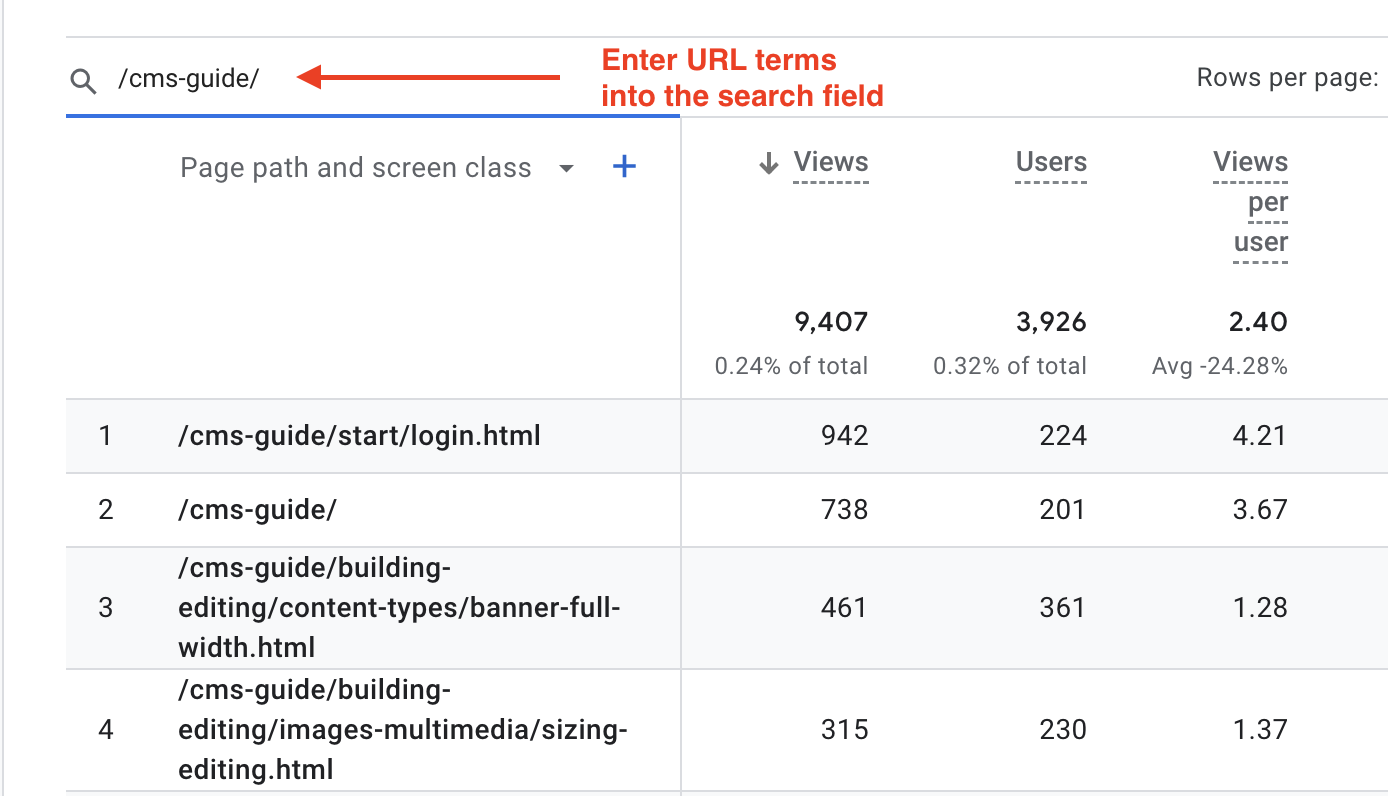
- By default the table displays Views, Users, Views per user, Average engagement time, Engagement rate, Bounce rate, etc. You can use the plus sign next to the Page path and screen class column header to add different dimensions (e.g., age, gender, device, etc.)
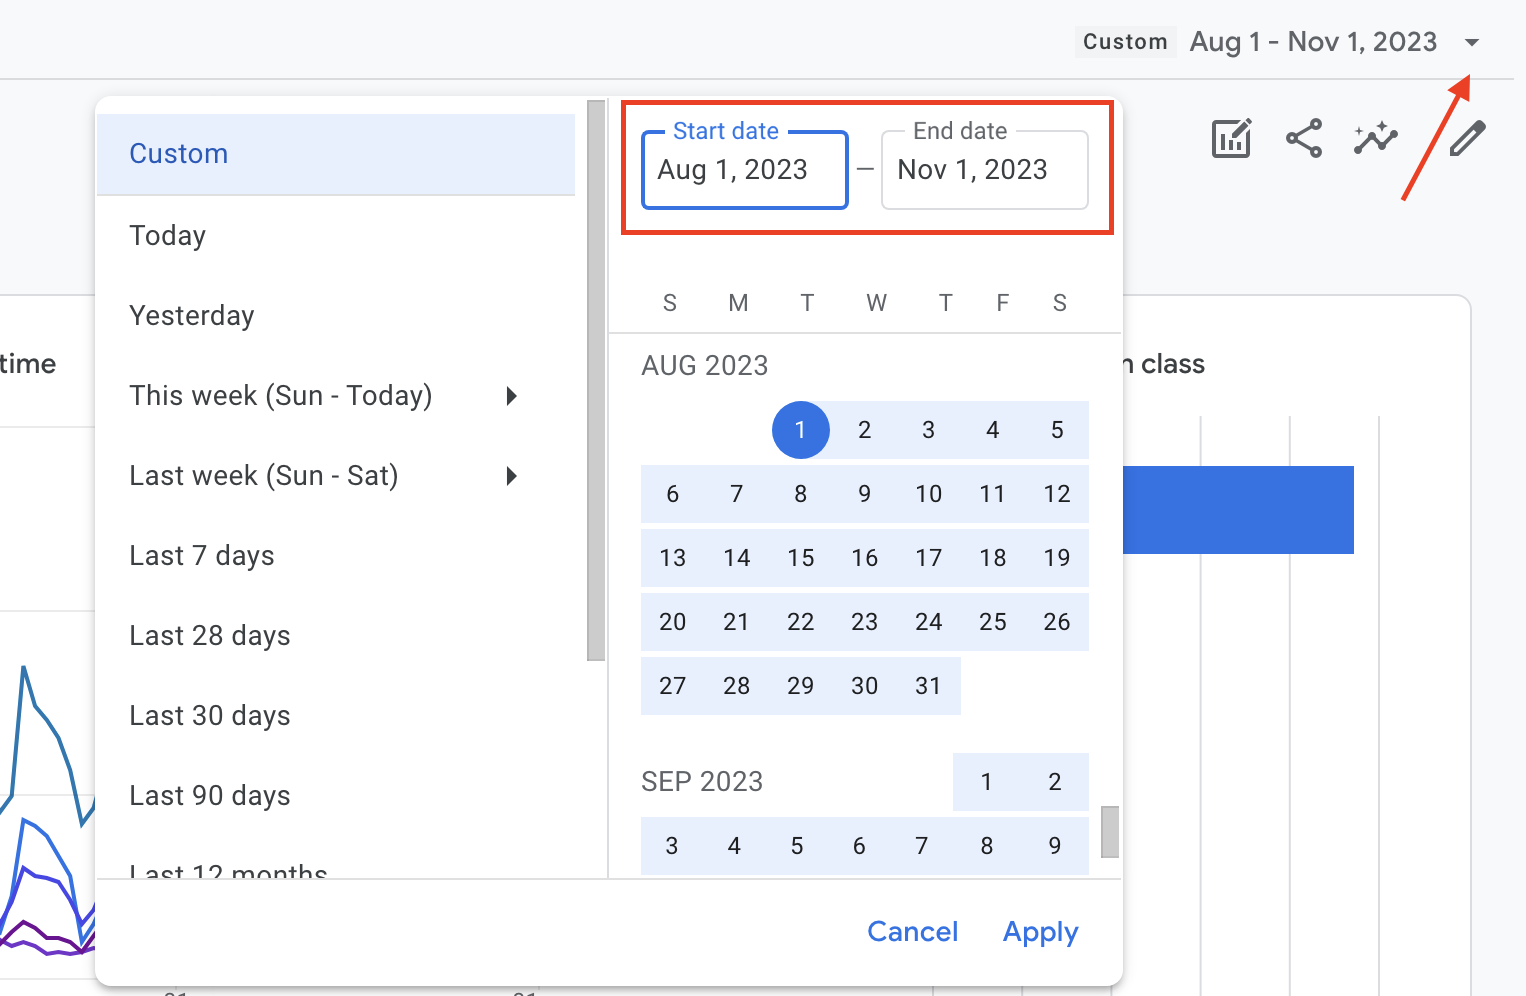
- Adjust the date range in the top right of the screen to retrieve data from a different time period.